Flavor based market information
| Sugar | No Sugar | Flavor | |||
| All provinces | Urban | Female age 30 - 64 | 30% | 60% | 10% |
| Rural | Female age 30 - 64 | 30% | 60% | 10% | |
| All provinces | Urban | M + F age - 15 29 | 40% | 20% | 40% |
| Rural | M + F age - 15 29 | 40% | 20% | 40% | |
| Size base | 1000 ml | 350 ml | |||
| All provinces | Urban | Female age 30 - 64 | 80% | 20% | |
| Rural | Female age 30 - 64 | 90% | 10% | ||
| All provinces | Urban | M + F age - 15 29 | 25% | 75% | |
| Rural | M + F age - 15 29 | 50% | 50% |
Durable ownership
The difference in income between rural and urban areas also makes a difference in the level of durable ownership (Chart 5).
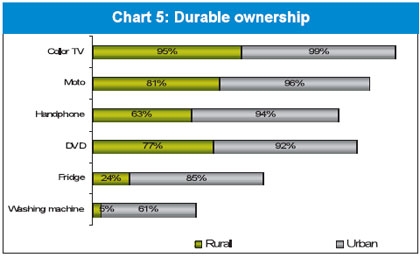 |
Items that are considered necessary for Vietnamese such as vehicles (motorcycles) and entertainment tools (color television) reported a very high ownership level in both areas. Besides, due to the high demand of communications, the development of the media industry and especially the price wars amongst mobile phone producers and service providers, the percentage of mobile phone ownership is relatively high in urban (94 per cent) and rural (63 per cent) areas.
Those living in urban areas have higher income levels, so they pay more attention to their family lives - this reflects in the ownership of products that provide convenience and creature features such as washing machines (61 per cent) and refrigerators (85 per cent). The lower ownership rate of these products in rural areas is easily explained by the lower incomes. Twenty-four per cent of respondents in rural areas said they owned refrigerators, suggesting that their incomes were positively changing.
Ownership of other creature feature products also differed by urban/rural areas, such as air conditioners - urban (32 per cent), rural (1 per cent), microwaves - urban (22 per cent), rural (1 per cent) and cars - urban (1 per cent), rural (0.2 per cent).
2011 consumer confidence
Vietnam’s economy in 2010 underwent a difficult period with high inflation, trade deficits and currency devaluation. However, the gross domestic product still grew by 6.78 per cent.
Based on TNS Vietnam’s 2011 Consumer Confidence Poll (Hanoi/Ho Chi Minh City 1,000) the consumer confidence index rose slightly from 78 to 79 for 2011 (Chart 6). Though not significant in consumer confidence upswing, it does show that consumer confidence has stabilised and should mean a slight increase in overall consumer spending.
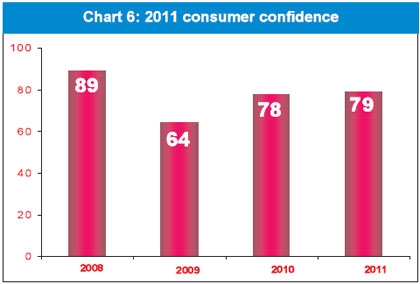 |
The Vietnamese consumer is one of the most optimistic in the world. In 2009, due to the influence of world economic crisis, the index of consumer confidence fell to 64. However, confidence was quickly restored in 2010 (78) with the rationale that the world economy and Vietnam had been undergoing the worst phase of the global economic crisis in 2008. Consumers’ incomes also saw increases compared to the previous year. For 2011, consumer confidence rose slightly, indicating that consumers felt the economy had stabilized and the worst was behind them.
Consumption in Vietnam in general fluctuates annually, but usually in an upward projection, as Vietnam evolves into developed nation status. This trend will continue, especially with mass media playing an increasingly important role in driving consumption, but devaluation and interest rates may well hamper consumer spending in 2011.
For 2011, Vietnam’s consumption market reports a stagnant growth trend in terms of spending, with only three of 11 sectors showing positive growth. However, considering that the previous year showed nine of 11 sectors growing in spending and that most sectors showed the same spending levels as in 2010, 2011 should continue to see growth, especially in education, food and beverages and healthcare products.
No comments:
Post a Comment